


Some of our subdomains work well, but we’re not going to talk about them. This article is about the surgical removal of about 1,000 subdomains that generated millions of superfluous duplicities. The operation took over six months and preparations lasted nearly a year. What did we do and what were the results?
Introduction
This article is the second in our series "Satan, SEO, and Subdomains". The previous instalment titled "Chaos Crawling" dealt with general questions and concepts, the limits of technologies and cyberspace, as well as a short history of Heureka. That’s enough of theory. Now let’s get into enterprise-level SEO1 in practice.
Let’s just quickly remind ourselves of the four main types of Heureka’s subdomains:
- Basic, systemic, and mobile subdomains (
www,m,blog,info) ~20 subdomains. - Category subdomains (
notebooky,mobilní-telefony,elektronika) ~2,500 subdomains. - Brand subdomains (
sony,nikon,apple) ~60,000 subdomains. - Parametric subdomains (
herni-notebook,android-telefony,xbox-360) ~1,000 subdomains.
This article will describe in detail the last point: the 1,000 subdomains or so that began to be created in 2010.
Hypothesis: Parasitic Tumours
Finding corrupt formulas of behaviour and weak points in a system with 65,000 subdomains and a sextillions functional URLs is quite a task. Imagine a pile of 650 kg of walnuts still in their shells. A little less than 10 kg contain rotten and mouldy nuts filled with maggots. How do you find them? How do you find subdomains infected with cybernetic cancer?
We started by going through everything manually. That sounds terrifying in a time of automation and a wealth of specialized tools, but we had no choice. No tool was able to effectively deal with the website. The „entertaining“ disadvantage enterprise-level websites have is they don’t fit into any tools (primarily crawlers) that offer „custom enterprise-level tariffs“.2
We put our heads together and started processing the website in smaller segments and started the manual identification of formulas.
We gradually ran into an interesting section on the lowest level of the category tree that showed unusual behaviour. It didn’t behave like the lowest level of the tree at all really. They didn’t make sense in terms of data, their organic performance was absolutely awful, and they generated a large volume of nonsensical URLs. Internally, they were dubbed „parametric categories“ or „parametric sections“. Under further examination, they seemed more like extensive tumours that began to grow outside the categories.
The Parametric Patient’s File
What is a „parametric category“? It’s a pseudo-category that represents an important key phrase and its foundation is a previously existing category. The best would be to show an example.
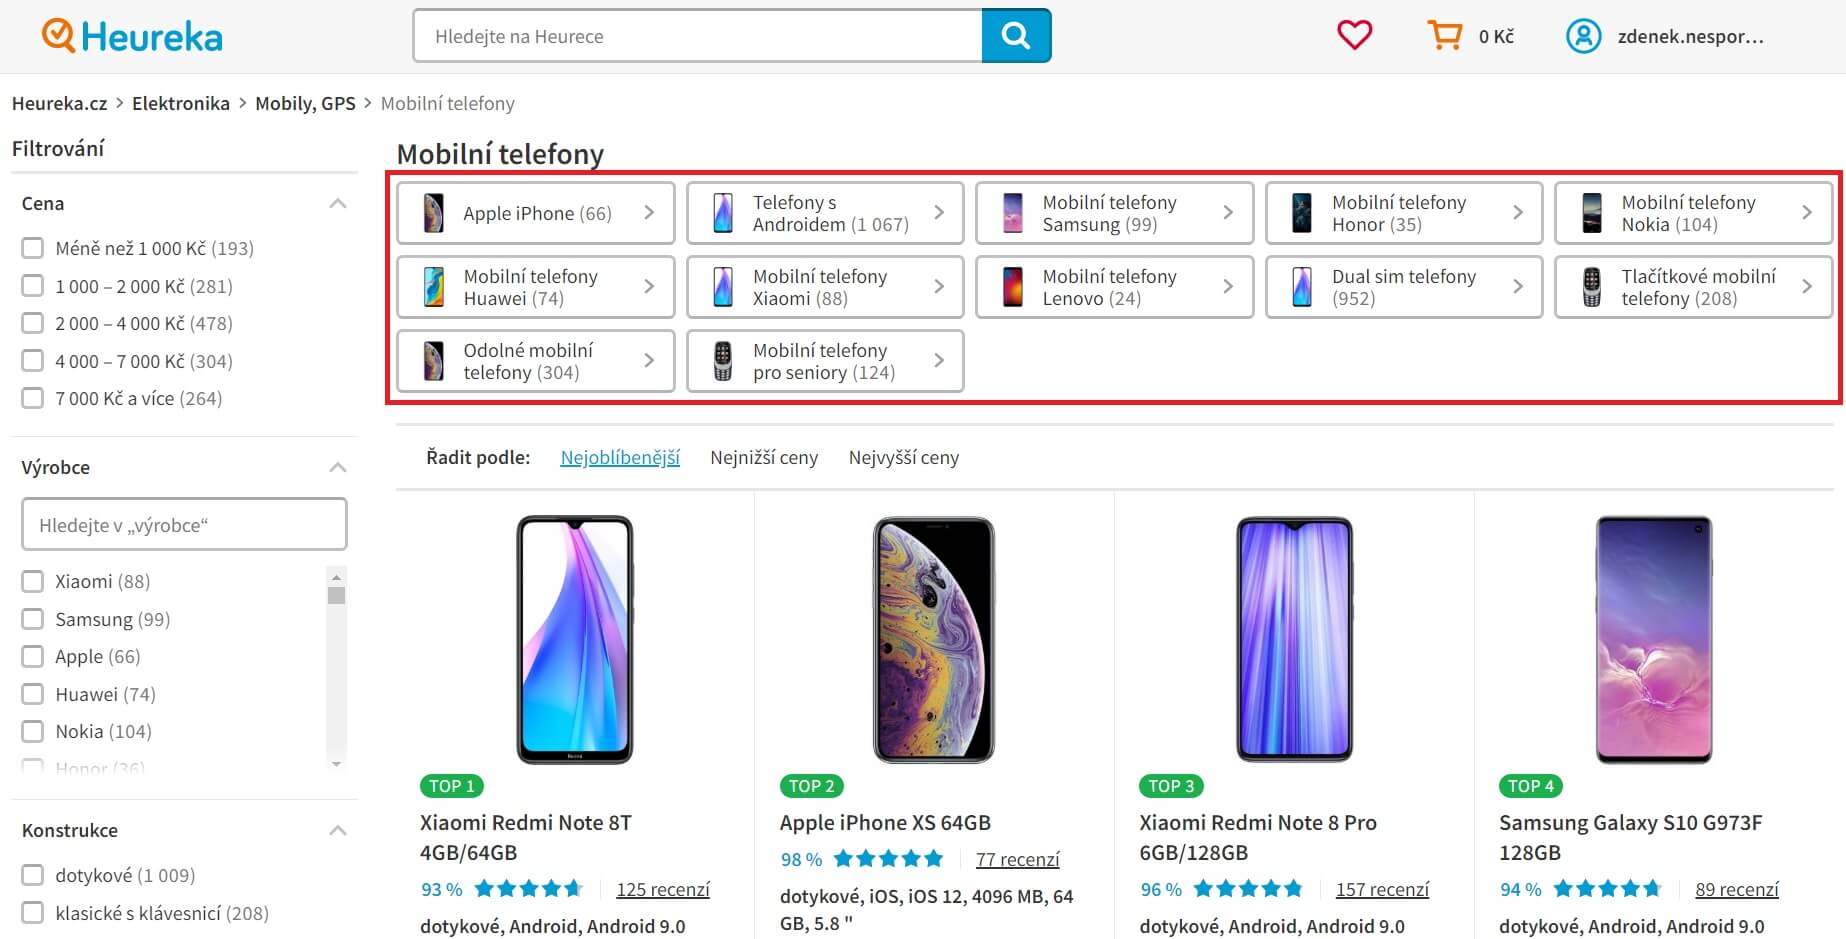
Category: If you look at the „Mobilni telefony“ (mobile telephones) category, then you see a block of links in the upper part (see the image below). These lead to pseudo-categories that we call the parametric section i. e. Apple iPhone.
Parametric: Created on the basis of product parameters: the parametric section of the Apple iPhone is a combination of the Mobilni telefony category and the Apple brand (filter) parameter.
Case History
The original system of parametric section worked as follows: We needed to offer users popular products (i. e.„Apple iPhone“). These had a target page that was the combination of the Mobilni telefony category and the selected Brand filter -> Apple. The result is the parametric URL https://mobilni telefony.heureka.cz/f:1666:101069/.
Normally, this URL and the target page would be completely sufficient. However, in 2010 the thinking was that subdomains provide „better SEO“, whatever that means. What was important was quantity over quality.
We took the parametric URL https://mobilni-telefony.heureka.cz/f:1666:101069/ and labelled it in the administrative system as the foundation for the subdomain https://iphone.heureka.cz. In the background, all filters relevant for the product with the parameter f:1666:101069 were automatically copied into the new subdomain where they created a duplicated system of parametric URLs.
iPhones were then available at the URL https://mobilni-telefony.heureka.cz/f:1666:101069/ and at https://iphone.heureka.cz in a completely identical form.
X-Rays
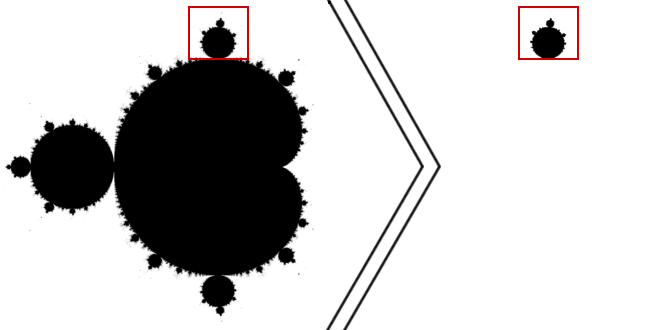
To better understand the situation, let’s have a look at the image that shows a Mandelbrot set3, which represents categories. The red box represents a part of a category where it would make sense to create a parametric section.
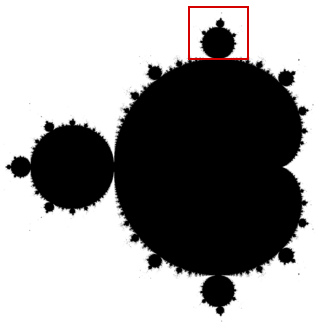
Everything in the red box was taken and copied to a lower level in the form of a pseudo-category. Both work in parallel next to one another as duplicities with the same fundamental characteristics and the same potential to generate a massive number of URLs thanks to inappropriate parametric filtration. That’s why we chose a picture of a fractal4 even though it’s more a visual-literary parallel and not a precise comparison.5
At this point, our main goal is clear: We want only one main category to exist. Subdomains with replicated content will have to be redirected, and the parametric section will only be created to emphasise specific content directly in a specific category. There will be no new subdomain pseudo-section. Instead, parametric sections will work as quick „shortcuts“ to pre-selected filters. It’s not rocket science.
An MRI of Ice Cream
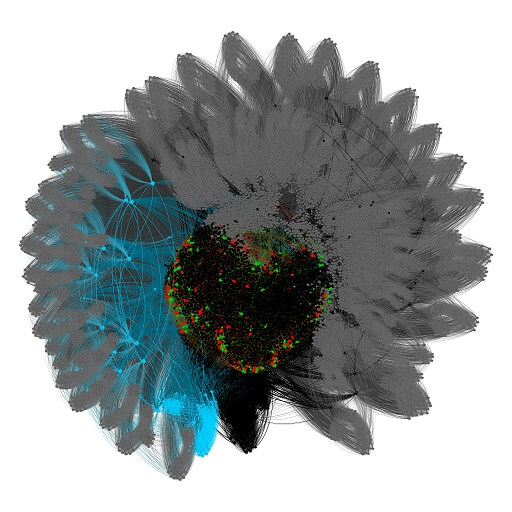
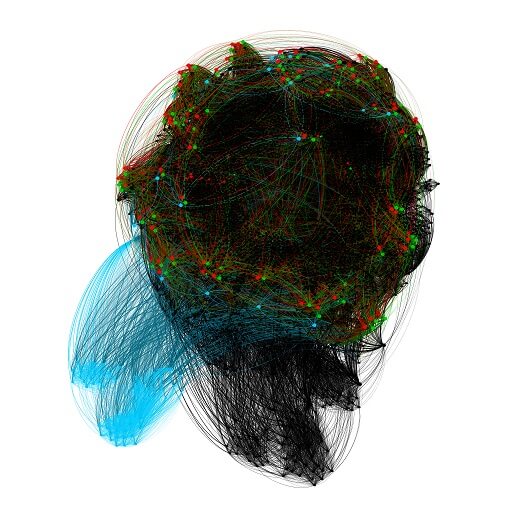
The whole problem with duplication and subsequent optimization can now be presented on the basis of a detailed analysis of the website’s network. We selected the zmrzliny.heureka.cz category ("zmrzlina" = ice cream) for this because it is one of the smaller ones and rather simpler to visualize. The last step of visualization kind of resembles a scoop of ice cream in a cone, which is a nice bonus.
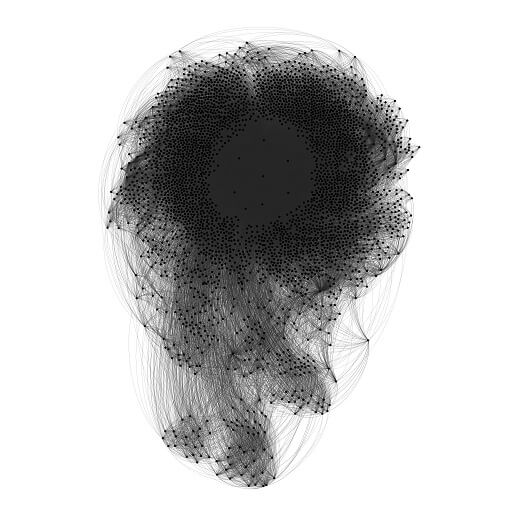
1. The first image represents the category’s complete dataset and three parametric sections. The category is labelled in black, while blue, red, and green represent the three parametric sections. The grey colour represents superfluous URLs that were created by inconsistent rules for the creation of internal links. This is a form of spider trap6 that we will no longer work with. These unnecessary URLs will therefore be filtered out in the next step.
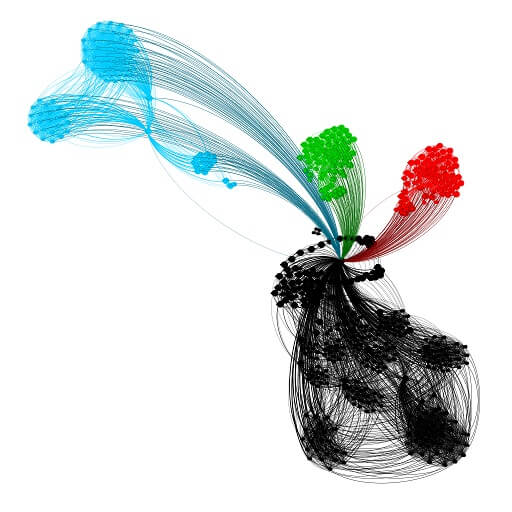
2. The second image represents the cleaned category, its parametric sections, and products. Now we just need to filter the data again and remove product URLs.
3. The third image shows only the core category and parametric section. In the next step, we can finally visualize and identify duplicities.
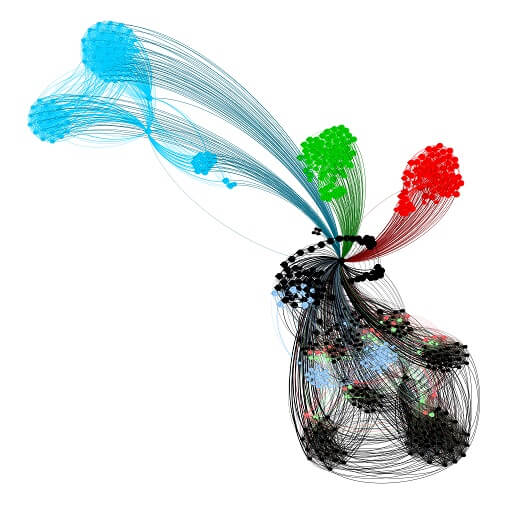
4. The source URLs in parametric categories are shown in a light shade of the given colour. In the case of blue nodes that create a more complicated structure, we can see similarities between the blue and light clusters. After isolating the core and identifying the duplicities, we have a formula that we can use to begin preparing and implementing 301 duplicity redirects.
5. Only the pure core category will be left after the redirects are implemented.
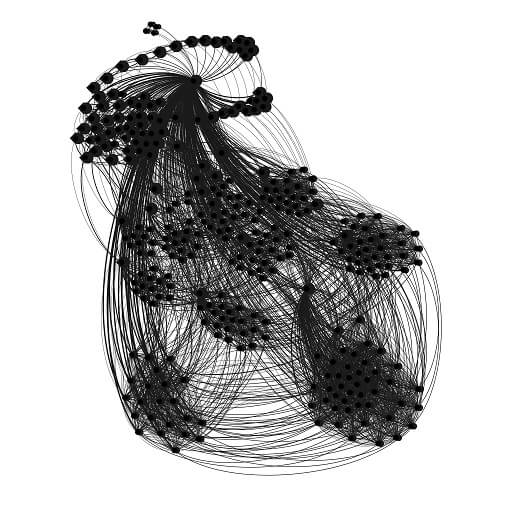
6. We can again tether products to a core category. The result is an ice cream category without duplicities.
Lab Results
The images of the web graphs7 are visually attractive, but won’t tell much to the untrained eye. They primarily serve as a visual representation of data and simplify searching for non-standard formulas. An essential fact of graph theory8 is that these are (discreet) mathematical models. The key output is thus not a visual representation in a graph, but the calculations performed using specialized algorithms.
The metrics that interest us are the length of the path of the website, the internal ranking of individual URLs, the „throughput“ of ranking flows, network modularity9, network averages, etc.
Tissue Analysis v.1
The first image shows changes to the original network (left) and the network after the removal of duplicities (right) generated by parametric subdomains.
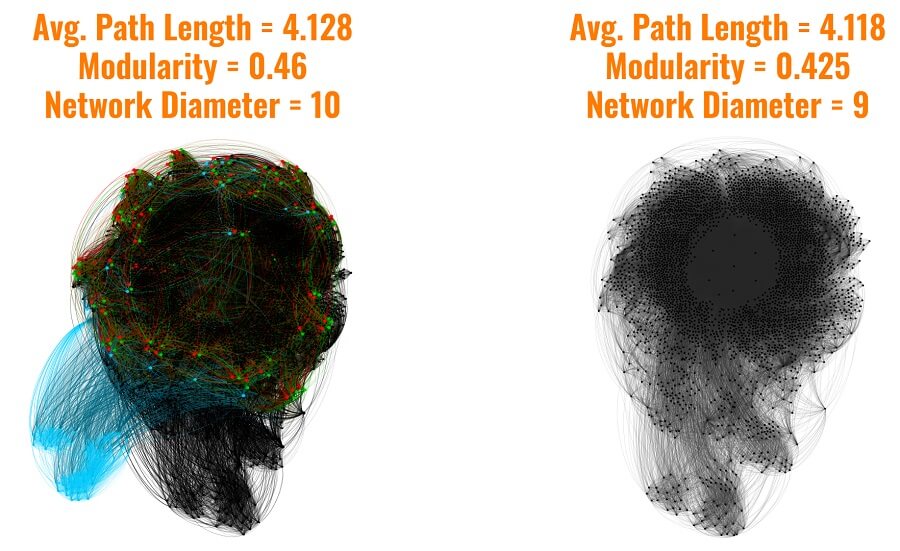
1. The average length of the path dropped a bit in the category. That means that a user had to click an average of 0.01 times less to reach the page that interests them. This makes the website a bit more effective for a search engine’s crawler. It may seem a hundredth of a click is inconsequential, but it’s not such a small number when totalled for a giant website. A reduction in the average path is always positive.
2. The modularity of the network also fell by 0.035. The modularity essentially expresses the complexity of the network: the strength and density of connections between individual clusters. We removed some clusters of nodes and connections and thus reduced the modularity. In our case this is a positive effect, but it doesn’t mean that a reduction in modularity is an important thing. On the contrary, this metric should be strengthened by the building of an effective network.
3. The last metric listed is network diameter, which dropped by 1. Again, we cannot say universally that a lower value is better because it is dependent on multiple factors. In our case the drop is positive, but changes to the network average are not the goal of optimization. This is more of a secondary indicator.
Tissue Analysis v.2
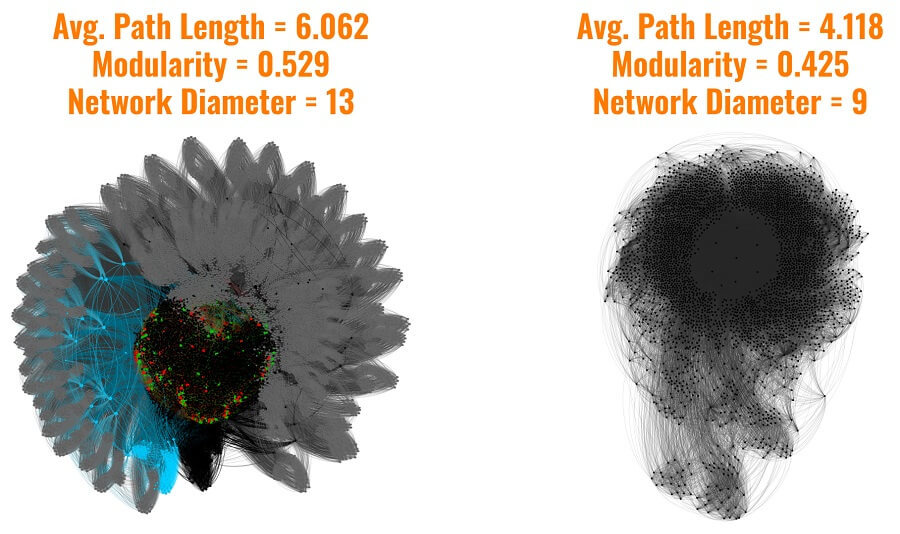
The second image shows a comparison of the original state with the spider trap (left) and the condition after deleting the parametric duplicities (right). As was mentioned before, the grey nodes on the edge of the graph are called spider traps.
Removing the causes and effects of this problem is still ahead of us, but as you can see the combined effect of all the changes will be absolutely phenomenal. This will reduce the average path length by 1,944, which will be a massive improvement for us! But that is a topic for another article in another series.
I hope we were able to help you understand how a network is optimized a bit.
The Surgery
We knew the state of the duplicities in detail with everything mapped out and documented. Then came the most critical phase: the 301 redirects for nearly a thousand subdomains and about 100,000,000 URLs.
All 1,000 parametric subdomains were placed into a table and separated into smaller logical units that were gradual waves of redirects. We worked with several variants of how redirects should work and how they should be separately phased-in.
The first successful tests took place in the summer of 2019 and our goal was to complete everything by the end of the year. The parametric subdomains table was then adjusted according to seasonal priorities and the potential risks posed by the size of a given subdomain.
The first wave of redirect tests was carried out on subdomains with minimum risk of negative effects. This was followed in further waves by electronics, winter, and Christmas goods so there would be enough time ahead of the Christmas shopping season to stabilize redirects, positions in searches, and eliminate any bugs that might appear.
The next four waves were less significant sections. The preparation and planning process took a bit longer, but was much safer and more effective. We certainly don’t feel bad about putting in the extra work.
Post-Operation Care
We gradually had to evaluate everything. For this, we employed Kibana and Google Analytics, which at the level of subdomains isn’t particularly easy, and we struggled with it a bit.
Regexator
In order to evaluate the changes effectively, we had to build the Regexator mini tool in Google Sheets that allowed us to simply create regular phrases from the URLs entered. We used Regex as the foundation of a custom segment in Google Analytics.
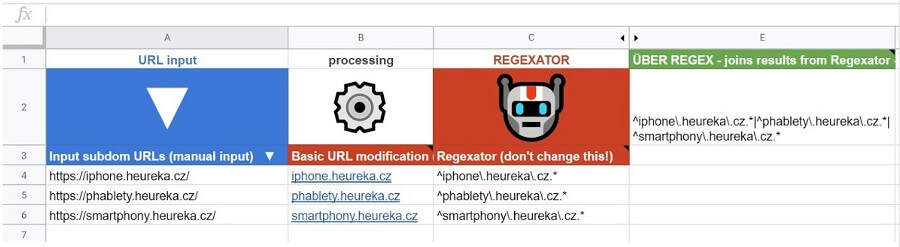
The tool is called URL Regexator today and has expanded to include many functions. It is available to the public as a Javascript web utility.
Making the Organic Rounds
All the changes were very positive. The screenshot from Google Analytics below shows the evaluation of the redirects for almost all parametric subdomains. It shows only Google Organic. The orange curve represents parametric URLs in categories to which the trace gradually shifted. The blue curves are parametric subdomains. The vertical red line represents the first redirects. And the horizontal red line serves as a visual comparison of the trace before and after.
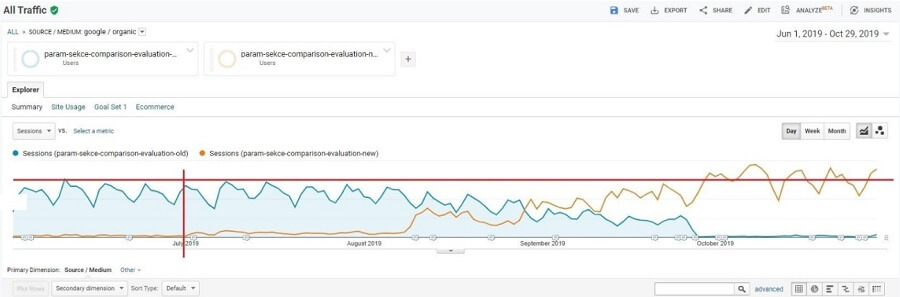
The redirects were a risky step, but in the end, they brought us an even larger number of traces and an increase to the conversion ratio. That was a secondary effect of not keeping users in a chaotic system of single-use subdomains and allowing them to utilize useful shortcuts in categories while giving them freedom of movement and more options.
Rehab
We haven’t mentioned one important thing: The creation of new parametric sections was blocked for years to prevent the creation of new subdomains. After completing our work, we had to gradually move on to a keyword analysis to begin effectively targeting other important keywords.
We performed a quick analysis for each category, which totalled around 2,500, and each micro keyword analysis took about 20 minutes of work. We quickly realized this wasn’t the way to do it.
Junior System
Part of the work on the micro analysis of keywords was supposed to be performed by a junior SEO temporary worker. Instead, we decided to take a step toward experimental automation using SQL.
We created a simple semi-automatic set of several tables and SQL queries that allowed us to process and store large volumes of datasets and quickly generate output analyses. See the SQL example below (the entire script is about 3× long.)
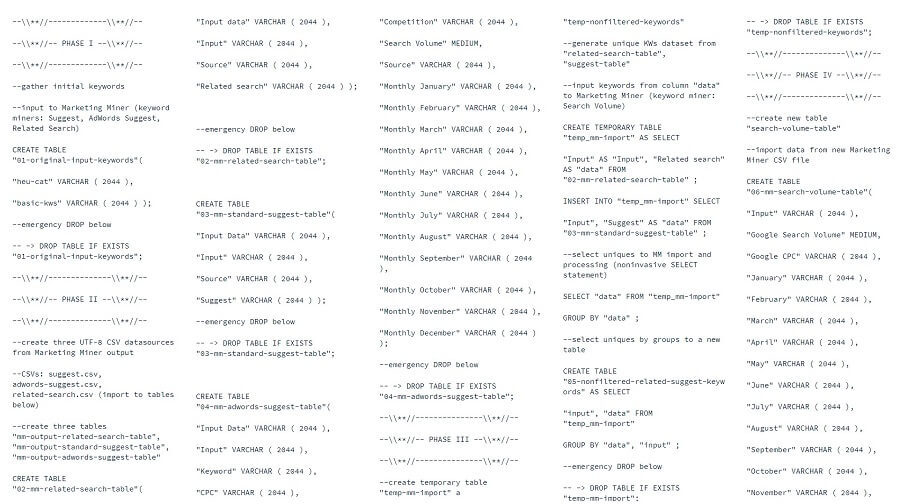
Currently, this is a simple prototype and proof of concept. We plan to develop a new tool in Python or Go that will work automatically from end-to-end and will have a user interface so co-workers from other departments could use it.
Ante-Mortem
The website and the categories survived the operation without damage and continue to operate and can grow in the right direction. The data has clearly shown us this step was positive for browser’s crawlers, but primarily for users who now can use the website more effectively.
Sometimes, you have to stop, cut any baggage loose in the form of dead tissue and tumours to make way for the growth of something more useful. We just avoided death, and we took a big step away from the edge of chaos.
Post-Mortem10
Work on the development of new parametric sections took place over several months in 2018–2019, which was a painful and unpleasant process. It was the first big response in terms of SEO. We cut into a structure that had been built up over nine years. Not only that, but very intensive development and gradual deployment of responsive categories took place in parallel. At one point, there were up to eight versions of the website in development and production:
- Old desktop Heureka with old parametric sections
- Old desktop Heureka with new parametric sections
- New desktop Heureka with old parametric sections
- New desktop Heureka with new parametric sections
- Old mobile Heureka with old parametric sections
- Old mobile Heureka with new parametric sections
- New mobile Heureka with old parametric sections
- New mobile Heureka with new parametric sections
Did you get lost in that list? No problem. We also got confused quite a bit. We were drowning in rivers of code, data, blood, and the sweat of everyone involved – developers, product managers, and webmasters.
Lesson #1: Terminology. You must define and specify terms at the beginning of any project. Confusion in who sees what as „new“ or „old“ was the toughest thing for us most of the time. A unified terminology across products, development, and SEO is a must! All you need is a 15-minute meeting at the beginning to clarify terms and the tasks at hand.
Lesson #2: Communication noise. Limiting the number of go-betweens means more effective communication. If a larger number of people transfer information, it never ends up being perfect. Have you changed tasks, found a problem, or do you need to check on progress? Always communicate directly with those who are actually working on that specific element.
Lesson #3: Sharing knowledge. The tasks must be explained to the product manager and to approve the method. Then the whole assignment must be handed over to development, either in-person or on a call. Not over Slack. That’s just not good enough.
Lesson #4: Clear communication. Communicate concisely, confidently, and without fear. Management, product, development, content, performance: they all have their own priorities. You need to know how to champion your own and then know how to transfer them on.
Lesson #5: Focus. Don’t undertake several large projects at once. It would be beautiful, but it doesn’t work most of the time. There will always be dozens of priorities and some things will be done concurrently. At Heureka, we helped ourselves quite a bit by implementing quarterly OKRs11. If the situation is untenable, then you need another team member.
It’s a fun list, right? There isn’t anything here related to precise data analyses, excellent knowledge of SEO, or the selection of the appropriate programming language. 301 redirects, analyses, and evaluations are relatively banal and routine. But the whole project depends on effective communication, correctly configured processes, and project management.12
Sterilizing Surgical Tools
Maybe you’re interested in the tools we used in the course of this work. Here’s a short list:
- Screaming Frog
- Excel
- Google Sheets
- Gephi
- Google Analytics
- Kibana
- Google Search Console
- Marketing Miner
- Collabim
- Valentina Studio
- Our brains13
Conclusion
The massive change to the parametric section allowed us to remove about 1.5% from the 65,000 subdomains. We redirected approximately 100,000,000 URLs, which cleared up space to create several thousand new parametric sections that we can work with any way we want without any risks.
The operation was a long one, but it was successful. Motivated by this success, we declared war on more subdomains. The next part of the series is called „Managed SEOcide by Slash and Burn“ will discuss the 60,000 brand subdomains. That text will be published some time in 2022.
Series on SEO and Subdomains
- Satan, SEO, and Subdomains – VOL I. – Crawling Chaos
- Satan, SEO, and Subdomains – VOL II. – Cancer SEOtherapy
- Satan, SEO, and Subdomains – VOL III – Controlled SEOcide
- Satan, SEO, and Subdomains – VOL IV. – One To Rule MFI
- Satan, SEO, and Subdomains – VOL V. – SEOfirot of the Tree of Life
- Satan, SEO, and Subdomains – VOL VI. – Horsemen of the SEOcalypse
Disclaimer
Approach this text carefully. This article and the series in general are not a guide. These texts don’t include any „universal truths“. Each website is a unique system with various initial conditions. An individual approach is necessary, as well as a perfect knowledge of the specific website and the given problems.
The article discusses our website. We aren’t generally evaluating the effectiveness of subdomains and directories. We also don’t recommend any specific solution. Again, this is a very individual matter that is influenced by many factors. The strategy and detailed plans for some of the activities described here were created over the course of a year. Everything was discussed exhaustively, constantly tested, and validated. Please remember that if you decide to do something similar.
Some of the data listed can be imprecise or purposefully distorted. Specific numbers, like organic traffic, revenue, conversion, etc. cannot be published for obvious reasons. The key information, like the number of subdomains, URLs, and our methods are recounted exactly without any embellishment.
The texts can include advanced concepts and models that are not standard in terms of SEO. The articles are thus accompanied by footnotes with sources that explain everything.
Footnotes:
In this context, enterprise-level is used to denote a gigantic website with several million URLs and a relatively large budget. On the other hand, there is also massive responsibility and unpleasant stress. ↩
For most of the tools we tried, enterprise-level means “a corporation with an unlimited budget and a medium-sized website with a total number of URLs not exceeding 5,000,000.” Just for comparison, just our sitemap recently had 500,000,000 URLs (written: five hundred million URLs). If there was a tool that could handle this volume of URLs, then it would cost us over an estimated CZK 600,000 per month. https://en.wikipedia.org/wiki/Enterprise_software ↩
Mandelbrot set: https://en.wikipedia.org/wiki/Mandelbrot_set ↩
Fractal: https://en.wikipedia.org/wiki/Fractal ↩
Author’s note: For better understanding, I recommend studying the previous entry in this series where we discussed cellular automation, discrete systems, and website rules and limitations. ↩
Spider trap: https://en.wikipedia.org/wiki/Spider_trap ↩
Webgraph: https://en.wikipedia.org/wiki/Webgraph ↩
Graph theory: https://en.wikipedia.org/wiki/Graph_theory ↩
Network modularity: https://en.wikipedia.org/wiki/Modularity_(networks) ↩
Postmortem in development: https://en.wikipedia.org/wiki/Postmortem_documentation ↩
Author’s note: Most projects I took part outside of Heureka before often died out. There were exceptions when it was the fault of an „idiot“ that we happily assigned the blame to, but in most cases the fundamental problems were insufficient communication and ineffective processes. ↩
The brain: The center of the central nervous system and a useful organ located in the skull. We recommend using it as often as possible! ↩
Author
Zdeněk Nešpor
SEO
Technically focused SEO specialist and webmaster.
 Follow us on Twitter
 Follow us on GitHub